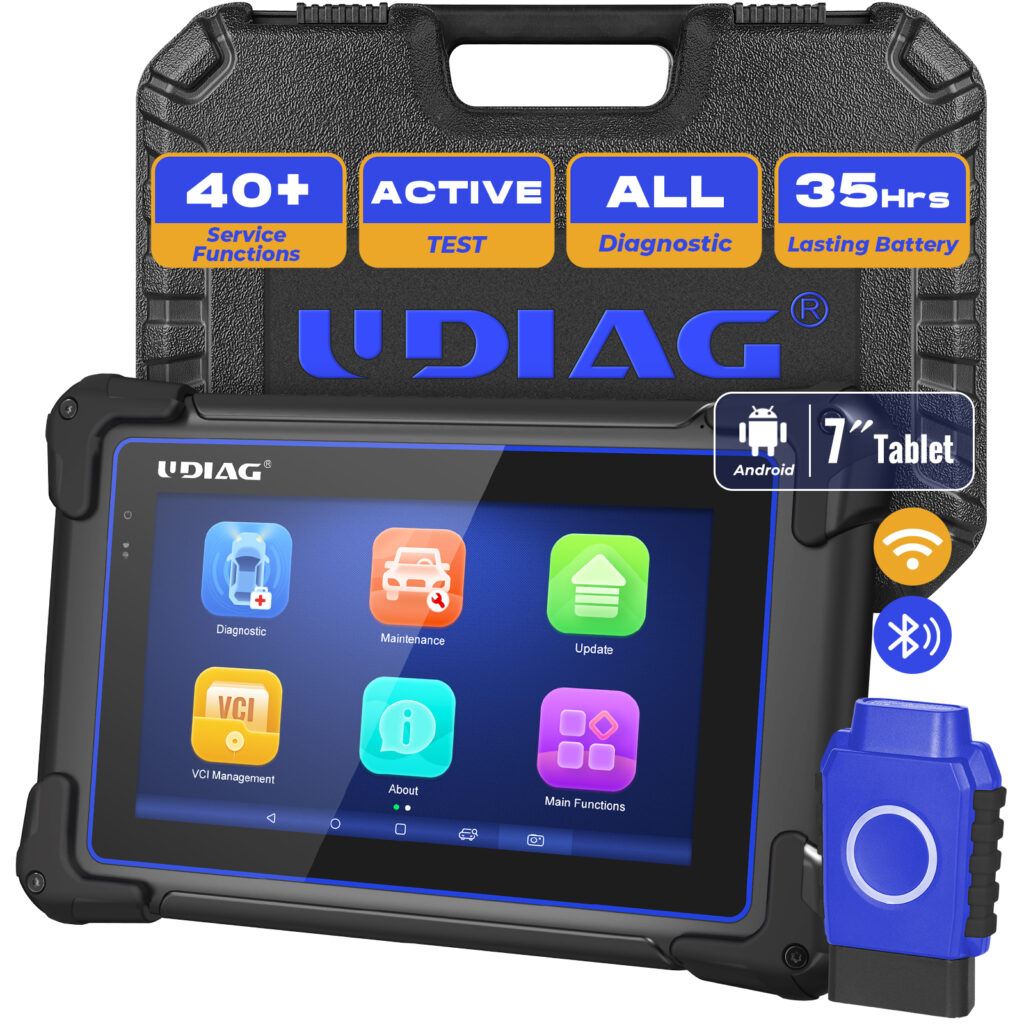
Visualizing Vehicle Health: Graphics in Diagnostic Tablets
2023-12-10 by UDIAG
In the dynamic landscape of automotive maintenance, the ability to diagnose and monitor vehicle health in real-time has become paramount. With the evolution of diagnostic tools, there has been a notable shift toward the integration of tablets, offering a portable and user-friendly solution for technicians. This essay explores the role of graphics in diagnostic tablets, delving into their importance in visualizing complex vehicle systems.

I. Basics of Vehicle Health Diagnostics
The diagnostic process in automotive systems is a critical aspect of ensuring optimal performance and identifying potential issues. Real-time monitoring has become increasingly important for early detection, and diagnostic tablets play a pivotal role in this regard. These tablets have become indispensable tools for modern automotive maintenance, streamlining the diagnostic process and providing technicians with valuable insights into a vehicle’s health.
II. Diagnostic Tablets: An Overview
Diagnostic tablets have evolved to offer advanced features such as wireless connectivity and compatibility with a wide range of vehicle makes and models. Their seamless integration with on-board diagnostics (OBD) systems allows for comprehensive monitoring and analysis. The focus of this essay is on the visual aspect of these tablets, specifically how graphics enhance the user experience and contribute to effective vehicle health visualization.
III. The Role of Graphics in Diagnostic Tablets
Graphics play a crucial role in making complex vehicle systems more accessible to technicians. The use of graphical user interfaces (GUIs) and thoughtful user experience (UX) design significantly improves the usability of diagnostic tablets. Visual representations of vehicle health data aid technicians in quickly understanding the status of various components and systems, facilitating efficient decision-making during diagnostics.
IV. Types of Graphics Used in Diagnostic Tablets
Diagnostic tablets leverage various types of graphics to represent vehicle health data effectively. Graphs and charts provide real-time data representation, making it easier to identify trends and abnormalities. Schematic diagrams offer a visual overview of intricate vehicle systems, while 3D models allow for in-depth exploration of components. These graphical elements collectively enhance the comprehensibility of complex data, enabling technicians to pinpoint issues with greater accuracy.
V. Advantages of Visualizing Vehicle Health
The advantages of visualizing vehicle health through graphics are multifaceted. Improved user comprehension and decision-making are evident outcomes, as technicians can quickly interpret visual representations of data. Graphics also facilitate enhanced communication between technicians and vehicle owners, fostering a better understanding of maintenance needs. Furthermore, the visual identification of issues streamlines troubleshooting, leading to more efficient and accurate diagnoses.
VI. Challenges and Solutions
While graphics offer significant benefits, challenges such as potential limitations and the need for accuracy must be addressed. Continuous updates and improvements in graphic software are essential to ensure reliability in visual representations. Overcoming these challenges is crucial for maintaining the effectiveness of diagnostic tablets in the ever-evolving field of automotive diagnostics.
VII. Case Studies
Several case studies highlight the successful implementation of graphics in visualizing vehicle health. These examples showcase the impact on diagnosis speed and accuracy, ultimately leading to increased customer satisfaction. Real-world scenarios demonstrate how diagnostic tablets with effective graphics contribute to positive outcomes in automotive maintenance.
VIII. Future Trends
Looking ahead, emerging technologies such as augmented reality (AR) and virtual reality (VR) are expected to further enhance the visualization capabilities of diagnostic tablets. These advancements, coupled with continuous improvements in graphic capabilities, herald an exciting future for vehicle health diagnostics.
Conclusion
In conclusion, the integration of graphics in diagnostic tablets is a transformative force in the field of automotive maintenance. The visual representation of vehicle health data not only improves the efficiency of diagnostics but also enhances communication and decision-making. As technology continues to advance, the role of graphics in visualizing vehicle health is set to become even more integral, shaping the future of automotive diagnostics.
Get Access Now: https://www.udiagtech.com
FAQs
Q1: What is the significance of visualizing vehicle health through graphics in diagnostic tablets?
Visualizing vehicle health through graphics in diagnostic tablets is crucial for enhancing user comprehension, facilitating efficient troubleshooting, and improving communication between technicians and vehicle owners. Graphics provide a visual representation of complex data, making it easier to interpret and identify issues in real-time.
Q2: How do diagnostic tablets contribute to the modern automotive maintenance landscape?
Diagnostic tablets play a pivotal role in modern automotive maintenance by offering features such as wireless connectivity, compatibility with various vehicle makes and models, and integration with on-board diagnostics (OBD) systems. They provide technicians with portable and user-friendly tools for real-time monitoring and analysis of vehicle health.
Q3: What types of graphics are commonly used in diagnostic tablets for visualizing vehicle health?
Diagnostic tablets leverage various types of graphics, including graphs and charts for real-time data representation, schematic diagrams for an overview of vehicle systems, and 3D models for in-depth exploration of components. These graphics collectively enhance the comprehensibility of complex data during the diagnostic process.
Q4: How do graphics in diagnostic tablets improve the user experience for technicians?
Graphics in diagnostic tablets improve the user experience by offering intuitive graphical user interfaces (GUIs) and user-friendly designs. Visual representations of vehicle health data make it easier for technicians to quickly understand the status of components and systems, leading to more efficient decision-making.
Q5: Can you provide examples of successful implementations of graphics in vehicle health diagnostics?
Yes, there are numerous case studies showcasing successful implementations of graphics in vehicle health diagnostics. These examples highlight the positive impact on diagnosis speed, accuracy, and customer satisfaction. Real-world scenarios demonstrate how diagnostic tablets with effective graphics contribute to positive outcomes in automotive maintenance.


